
![Raspberry Pi Docker Monitor]() Raspberry Pi Docker Monitor
Raspberry Pi Docker Monitor
Stack
Monitor your Raspberry Pi and Dockers using Grafana developed by oijkn. Please download grafana configs from his git https://github.com/oijkn/Docker-Raspberry-PI-Monitoring
Source details
Configuration
TypeComposelinux3000:3000/tcpPROMETHEUS_RETENTION=15dunless-stoppedTemplate by novaspirit·Source
Report issueNotes
Check our Github page: https://github.com/pi-hosted/pi-hosted
Official Webpage: https://github.com/pi-hosted/pi-hosted/blob/master/docs/rpi_docker_monitor.md
Official Docker Documentation: https://github.com/pi-hosted/pi-hosted/blob/master/docs/rpi_docker_monitor.md
Pi-Hosted dedicated documentation: rpi_docker_monitor.md
Pre-installation script must be RAN before you install: wget -qO- https://raw.githubusercontent.com/pi-hosted/pi-hosted/master/tools/rpi_docker_monitor.sh | bash
Youtube Video: Novaspirit Tech - Raspberry Pi Docker Monitoring
Services
cadvisor
Configuration
Imagezcube/cadvisor:latest--docker_only=true,--housekeeping_interval=30s,--disable_metrics=accelerator,cpu_topology,disk,memory_numa,tcp,udp,percpu,sched,process,hugetlb,referenced_memory,resctrl,cpuset,advtcp,memory_numa,--store_container_labels=false,--event_storage_event_limit=default=0,--event_storage_age_limit=default=0/rootfs : //var/run : /var/run/sys : /sys/var/lib/docker : /var/lib/docker//etc/machine-id : /etc/machine-idunless-stoppedImage details
grafana
Configuration
Imagegrafana/grafana:latest3000:3000/var/lib/grafana : /portainer/Files/AppData/Config/grafana/data/etc/grafana/grafana.ini : /portainer/Files/AppData/Config/grafana/grafana.ini/etc/grafana/provisioning : /portainer/Files/AppData/Config/grafana/provisioningGF_USERS_ALLOW_SIGN_UP=falseGF_PATHS_CONFIG=/etc/grafana/grafana.iniGF_PATHS_DATA=/var/lib/grafanaGF_PATHS_HOME=/usr/share/grafanaGF_PATHS_LOGS=/var/log/grafanaGF_PATHS_PLUGINS=/var/lib/grafana/pluginsGF_PATHS_PROVISIONING=/etc/grafana/provisioningunless-stoppedImage details
node-exporter
Configuration
Imageprom/node-exporter:latestunless-stoppedImage details
prometheus
Configuration
Imageprom/prometheus:latest--config.file=/etc/prometheus/prometheus.yml,--storage.tsdb.path=/prometheus,--storage.tsdb.retention.time=${PROMETHEUS_RETENTION:-15d}/prometheus : /portainer/Files/AppData/Config/prometheus/data/etc/prometheus/ : /portainer/Files/AppData/Config/prometheus/configunless-stoppedImage details
Standalone Install
Select an install method, to see config/commands for deploying Raspberry Pi Docker Monitor
Install on Portainer
Import all app templates into your Portainer instance, for easy 1-click deploys
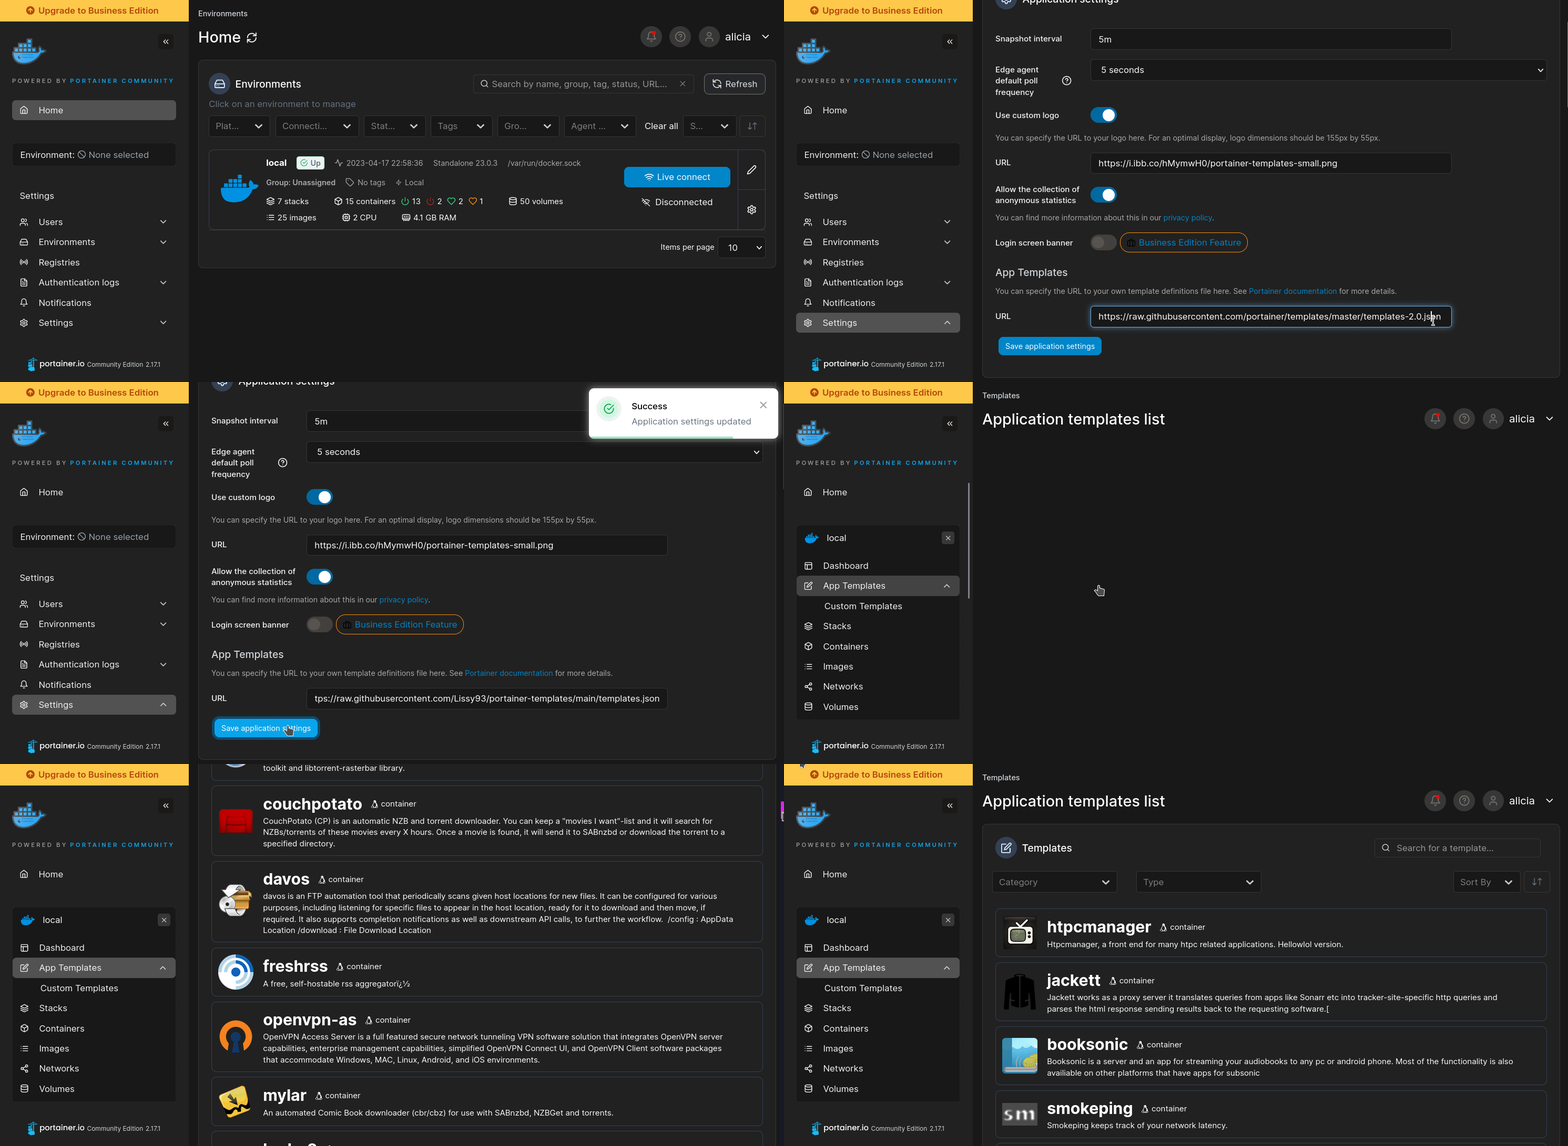
- Ensure both Docker and Portainer are installed, and up-to-date
- Log into your Portainer web UI
- Under Settings → App Templates, paste the below URL
- Head to Home → App Templates, and the list of apps will show up
- Select Raspberry Pi Docker Monitor, fill in any config options, and hit Deploy
Template Import URL
https://raw.githubusercontent.com/Lissy93/portainer-templates/main/templates.json
Show Me
Original stackfile
The compose file this template deploys, straight from its repo:
version: "2.4"
services:
  cadvisor:
    command:
    - '--docker_only=true'
    - '--housekeeping_interval=30s'
    - '--disable_metrics=accelerator,cpu_topology,disk,memory_numa,tcp,udp,percpu,sched,process,hugetlb,referenced_memory,resctrl,cpuset,advtcp,memory_numa'
    - '--store_container_labels=false'
    - '--event_storage_event_limit=default=0'
    - '--event_storage_age_limit=default=0'
    container_name: monitoring-cadvisor
    devices:
      - /dev/kmsg:/dev/kmsg
    expose:
      - 8080
    hostname: rpi-cadvisor
    image: zcube/cadvisor:latest
    ipc: shareable
    networks:
      - rpimonitor_default
    privileged: true
    restart: unless-stopped
    security_opt:
      - label=disable
    volumes:
      - /:/rootfs:ro
      - /var/run:/var/run:rw
      - /sys:/sys:ro
      - /var/lib/docker/:/var/lib/docker:ro
      - /etc/machine-id:/etc/machine-id:ro

  grafana:
    container_name: monitoring-grafana
    environment:
      - GF_USERS_ALLOW_SIGN_UP=false
      - GF_PATHS_CONFIG=/etc/grafana/grafana.ini
      - GF_PATHS_DATA=/var/lib/grafana
      - GF_PATHS_HOME=/usr/share/grafana
      - GF_PATHS_LOGS=/var/log/grafana
      - GF_PATHS_PLUGINS=/var/lib/grafana/plugins
      - GF_PATHS_PROVISIONING=/etc/grafana/provisioning
    hostname: rpi-grafana
    image: grafana/grafana:latest
    networks:
      - rpimonitor_default
    ports:
      - 3000:3000
    restart: unless-stopped
    volumes:
      # to be modified depending on your needs
      - /portainer/Files/AppData/Config/grafana/data:/var/lib/grafana
      - /portainer/Files/AppData/Config/grafana/grafana.ini:/etc/grafana/grafana.ini
      - /portainer/Files/AppData/Config/grafana/provisioning:/etc/grafana/provisioning

  node-exporter:
    container_name: monitoring-node-exporter
    expose:
      - 9100
    hostname: rpi-exporter
    image: prom/node-exporter:latest
    networks:
      - rpimonitor_default
    restart: unless-stopped

  prometheus:
    command:
      - '--config.file=/etc/prometheus/prometheus.yml'
      - '--storage.tsdb.path=/prometheus'
      - '--storage.tsdb.retention.time=${PROMETHEUS_RETENTION:-15d}'
    container_name: monitoring-prometheus
    expose:
      - 9090
    hostname: rpi-prom
    image: prom/prometheus:latest
    user: root
    networks:
      - rpimonitor_default
    restart: unless-stopped
    volumes:
      # to be modified depending on your needs
      - /portainer/Files/AppData/Config/prometheus/data:/prometheus
      - /portainer/Files/AppData/Config/prometheus/config:/etc/prometheus/
    links:
      - cadvisor:cadvisor
      - node-exporter:node-exporter

networks:
  rpimonitor_default:
Or deploy it directly from the source:
git clone https://github.com/pi-hosted/pi-hosted
cd pi-hosted
docker compose -f stack/raspberrypi-monitoring.yml up -d
More install options in our documentation, or see oijkn/Docker-Raspberry-PI-Monitoring for app-specific guidance.
Container Documentation
cadvisor Documentation
cAdvisor image for multiarch(386, amd64, arm/v6, arm/v7, arm64, ppc64le, s390x)
grafana Documentation
The official Grafana docker container
node-exporter Documentation
prom/node-exporter
prometheus Documentation
prom/prometheus
Serve Raspberry Pi Docker Monitor on your own domain behind Caddy, Nginx or Traefik. Fill in your domain and copy the result. It's a starting point, some apps need their own base URL or extra headers set too.
Proxying raspberry-pi-docker-monitor.example.com to http://grafana:3000
Add this to your Caddyfile
raspberry-pi-docker-monitor.example.com {
	reverse_proxy http://grafana:3000
}Check the logs first
Nine times out of ten the logs tell you exactly what went wrong.
- In Portainer, go to Containers, click the container, then Logs. Or run
docker logs <container> - Exit codes help too:
137means killed, usually out of memory.126or127means the command inside the image is broken.
Port already in use
If deployment fails with "Bind for 0.0.0.0:3000 failed: port is already allocated", something else on your server is using that port.
- Find what's using it:
sudo ss -tlnp | grep :3000 - Stop the other service, or pick a different host port. In
3000:3000only the left number is yours to change, the right one belongs to the app.
Running but the page won't load
The container is up but nothing appears in your browser.
- Use your server's real IP:
http://your-server-ip:3000. The 0.0.0.0 link Portainer shows isn't a real address. - Give it a minute after first deploy, raspberrypi-docker-monitor can take a while to initialise.
- Make sure your firewall allows the port, e.g.
sudo ufw allow 3000
Permission denied on volumes
If the logs show "permission denied", the app can't write to its data folder on the host.
- Fix the ownership:
sudo chown -R 1000:1000 /(and the same for the other mapped folders)
Image won't pull
Test the pull directly on the host: docker pull zcube/cadvisor:latest
- "manifest unknown" means the tag no longer exists. This template uses
latest, so try pinning a specific version instead. - "toomanyrequests" is the Docker Hub rate limit. Log in with
docker loginto raise it. - "no space left on device" means a full disk. Reclaim space with
docker system prune
"exec format error"
This means the image was built for a different CPU architecture than your server.
- Check yours with
uname -m: x86_64 is amd64, aarch64 is arm64. Raspberry Pi and other ARM boards are the usual culprits.
Container keeps restarting
The unless-stopped restart policy relaunches the app after every crash, so the real error can scroll past.
- Check the logs right after a restart, the last few lines before it died are the useful ones.
- Get the exit code with
docker inspect <container> --format '{{.State.ExitCode}}' - Still stuck? Redeploy once with the restart policy set to
noso the failure stays visible.
Stack won't deploy
Compose stacks fail fast on small mistakes, and Portainer shows the reason just above the editor.
- YAML only accepts spaces for indentation, a single tab breaks the whole file.
Raise an issue
Found something which isn't working as it should? Here's how to report it.
- Bug within the app: Open an issue on oijkn/Docker-Raspberry-PI-Monitoring
- Template not working: Open an issue on novaspirit/pi-hosted
- This website not working: Open an issue on lissy93/portainer-templates
A Compose stack
Raspberry Pi Docker Monitor is a Compose stack, a set of containers (4 of them) defined in one file and brought up together by Portainer, then started and stopped as a single app.
The services
This stack is built from 4 containers that run side by side. Here's each one, with the image it runs and anything it waits for first:
cadvisorrunszcube/cadvisor:latestgrafanarunsgrafana/grafana:latestnode-exporterrunsprom/node-exporter:latestprometheusrunsprom/prometheus:latest
Ports
A port is the door the app answers on. A mapping like 3000:3000 means it's reachable on port 3000 of your server, where the left number is yours to change and the right one belongs to the app. Once it's running, open http://your-server-ip:3000 in a browser. It opens:
3000:3000, likely the web interface
Volumes
A volume is where Raspberry Pi Docker Monitor keeps its files so they survive an update or a restart. Without one, anything it saves would sit inside the container and vanish the moment it's recreated. This template mounts:
/rootfsfrom/on the host/var/runfrom/var/runon the host/sysfrom/syson the host/var/lib/dockerfrom/var/lib/docker/on the host/etc/machine-idfrom/etc/machine-idon the host/var/lib/grafanafrom/portainer/Files/AppData/Config/grafana/dataon the host/etc/grafana/grafana.inifrom/portainer/Files/AppData/Config/grafana/grafana.inion the host/etc/grafana/provisioningfrom/portainer/Files/AppData/Config/grafana/provisioningon the host/prometheusfrom/portainer/Files/AppData/Config/prometheus/dataon the host/etc/prometheus/from/portainer/Files/AppData/Config/prometheus/configon the host
Environment variables
Environment variables are the settings you hand over when you deploy, things like a password or a timezone. Raspberry Pi Docker Monitor takes 7 of them, all with defaults you can leave alone or tweak:
GF_USERS_ALLOW_SIGN_UP, defaults tofalseGF_PATHS_CONFIG, defaults to/etc/grafana/grafana.iniGF_PATHS_DATA, defaults to/var/lib/grafanaGF_PATHS_HOME, defaults to/usr/share/grafanaGF_PATHS_LOGS, defaults to/var/log/grafanaGF_PATHS_PLUGINS, defaults to/var/lib/grafana/pluginsGF_PATHS_PROVISIONING, defaults to/etc/grafana/provisioning
Restart policy
The restart policy here is unless-stopped, so Docker restarts Raspberry Pi Docker Monitor after a crash or reboot, but leaves it off when you stop it on purpose. You can change this on the deploy screen. The choices are no (never restart), on-failure (only after a crash), unless-stopped (restart unless you stop it), and always (bring it back no matter what).
Networking
Portainer puts these services on one shared private network, so they can find each other by name (like cadvisor) while only the ports above are open to you.
Platform
The platform is linux, the kind of system the container is built to run on. Docker and Portainer handle this on a normal Linux server.
Open source license
Raspberry Pi Docker Monitor is open source, released under the MIT license. In plain terms the code is out in the open, so you're free to run it and change it to fit what you need.
Portainer app templates
Zooming out, this whole page comes from a Portainer app template: a short recipe telling Portainer how to set Raspberry Pi Docker Monitor up. Add the template list to Portainer once, then deploying Raspberry Pi Docker Monitor is a click rather than a wall of config.